Create a visually appealing, colorful image that illustrates a mathematical graph. The graph should be of an intriguing, complex function f(x), plotted on a traditional Cartesian plane. The graph should present roots or x-intercepts at integer values of 6, -2, -6, 2, and -12. The graph should be detailed with a gradient color scheme for the function line, grid lines for ease of understanding, and the specific points highlighted on the X-axis.

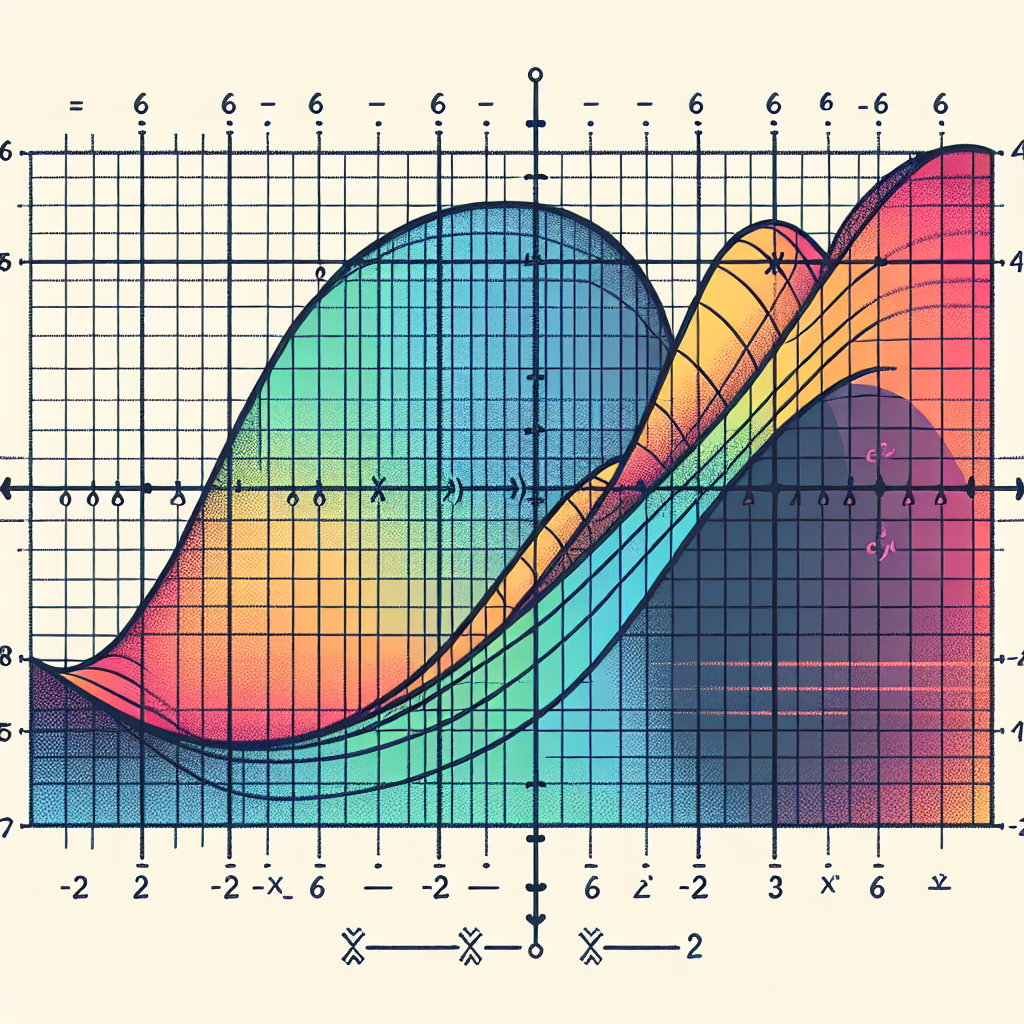
Use the graph of f(x) to find the solutions to the equation f(x) = 0.

A) two solutions: x = 6, –2

B) two solutions: x = –6, 2

C) one solution: x = –12

D) no solutions

Based on the graph, it can be seen that f(x) crosses the x-axis at x = -6 and x = 2. Therefore, the solutions to the equation f(x) = 0 are x = -6 and x = 2.

So, the answer is B) two solutions: x = –6, 2.