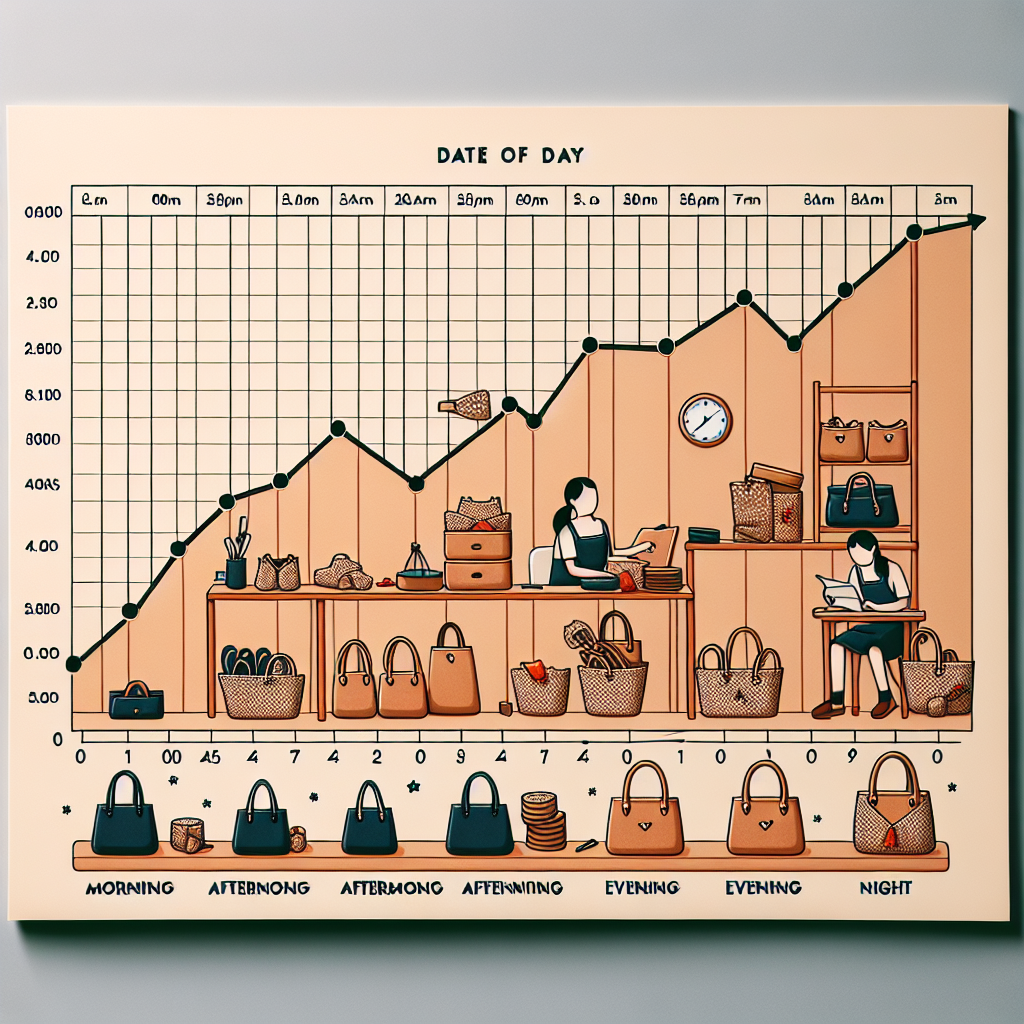
The graph shows the number of handbags that Mandy made in one day. What are the variables? Describe how the variables are related at various points on the graph.
I will attach the graph in the comments right now:)
the answer is that while the time is increasing the handbags the mandy is making are increasing too. The time would be the independent variable and the handbags are the dependent variable. i Just took the quiz
never mind don't read that
^ ______________
| |
| |
| _____|
| |
| |
| _____|
| |
|___|_______________>
I love you all
sorry for waisting your time :(
Finally an actual answer to the question!
I like that tekashi physically spent the time to look up the answer for this question and tells everyone else to stop cheating. does that just...exclude yourself from the rule? lol
but yeah, it makes sense what 'connexus' said back in 2016 at the top. (ignoring the comments with all the answers, I wanna have some originality i just wanted to word it differently lol)
Do you guys realize that everyone gets different problems and answers?? Not everyones test is the same, you guys are stupid lol
1. C
2. C
3. D
4. C Decreasing, Linear
5. A Y=4^x
6. D Y= (x+4)^2
7. B C(n)=0.75n-0.5;$7:00
8. B
9. D
10. C 180 baseballs
11. D no
12. B Yes -9
13. A
14. D
15. C
16. A
17. Self Answer
18. Self Answer
19. Self Answer---11.03 would be the price that you pay for a shirt that would regularly cost 15.50.
20. Self Answer
19. The graph shows the number of handbags that Mandy made in one day. What are the
variables? Describe how the variables are related at various points on the graph.
can i draw it out with the keys on my keyboard
yoo anyone got em answers for the Unit 5, lesson 9 test? rlly rlly need answers
it's different for lots of ppl so someones answer that is right for others might get you a 2/19 lol. it sucks : ( i have tons of overdues reee
can someone actually write the answer and not the letter -__-
your a god
Are these the answers for unit 5 lesson 9?
15.d
And I said some of Random's are wrong mine are 100% C O R R E C T
Hi, These are the answers for the quiz for non honor students:
1.A
2.C
3.D
4.B
5.D
6.D
7.A
8.C
9.C
10.A
11.B
12.D
13.A
14.B
15.C
16.A
17.D
The rest your on your own :D
This is according to the date it was posted on.
I will post honors answers shortly
is he right?
all are correct but 15
clothing store bargain days question help:
p (t)= $8.25t - $5.00
t=11.00 <------NOT 11 DOLLARS SORRY!
$8.25 (11) - $5.00= $85.75
I got a 9/15 because if Random. They're information is jumbled up. My answers are from Unit 9 Lesson 5 on Connections Academy.
a
d
c
c
c
b
a
b
a
a
b
a
c
c
Im using @westancupcakes ill let yall know how it goes
clothing store bargain days question help:
p (t)= $8.25t - $5.00
t=$11.00
$8.25 ($11.00) - $5.00= $85.75
y'all dumb the test is different for everyone
@ anonymous most of the time, we do, but sometimes on unit tests they will switch it up
does this help any? IDK, haven't submitted the test yet. found this Quizlet online...
ttps://quizlet.com/248671877/1-test-introduction-to-functions-unit-test-flash-cards/)))
The independent variable is always displayed on the x-axis of a graph, while the dependent variable appears on the y-axis.
Time is a common independent variable, as it will not be affected by any dependent environmental inputs.
THIS IS FOR THE UNIT 5: LESSON 9 INTRODUCTION TO FUNCTIONS TEST!
1. C
2. D
3. D
4. C
5. A
6. B
7. A
8. D
9. A
10. D
11. D
12. B
13. A
14. D
15. B
16-19 Are extended response
i need help with unit6 lesson four test/quiz
Did anyone figure it out?
I have 21 q's
sorry if it doesnt work
Mandy's handbags are depending on time. Therefore, her time is independent variable. Think of gaming. the more time you have the more you game....gaming is on the Y axis (up and down) time is on X axis (bottom)
Introduction to Functions: Functions Unit Test (unit 5, lesson 9)
November 14th, 2022
1. A zoo is keeping track of the weight of a baby elephant. The table shows the weight for the first, second, third, and fourth weeks. Which graph could represent the data shown in the table?
Week | Weight
1 138
2 159
3 175
4 185
C: (it kinda looks like a hill, not a straight line)
2. An ice cream shop is keeping track of its monthly sales in the fall. The table shows the number of ticket sales for the first, second, third, fourth months. Which graph could represent the table?
Month | Sales
1 1,376
2 1,045
3 912
4 850
Answer: D
3. In the diagram below, what is the relationship between the number of rectangles and the perimeter of the figure they form?
D:
# of rectangles | perimeter
1 16
2 20
3 24
4. The table below shows the relationship between the number of members in a group and the minutes each member speaks during the presentation.
Members | Minutes
2 11
3 8
4 5
5 2
Is the relationship a function that is increasing or decreasing? Is the relationship a function that is linear or nonlinear?
C: decreasing, linear
5. The ordered pairs (1,1), (2,6), (3, 81), (4, 256), and (5, 625) represent a function. What is a rule that represents this function?
C: y=x^4
6. Bananas are on sale for $0.40 a pound, and you have a coupon for $0.25 off your total purchase. Write a function rule for the cost of n pounds. How much would 30 pounds of bananas cost?
C: C(n)=0.4n-0.25; $11.75
7. Identify the mapping diagram that represents the relation and determine whether the relation is a function.
{(-2,-4), (-1,-4), (3,-4), (6,-4)}
B: the relation is a function
8. Identify the mapping diagram that represents the relation and determine whether the relation is a function.
{(-2,-5), (-1,-3), (-2,6), (5,7)}
B: This relation is not a function
9. The function b(n)=6n represents the number of light bulbs b(n) that are needed for n chandeliers. How many light bulbs are needed for 15 chandeliers?
A: 90 light bulbs
10. Tell whether the sequence is arithmetic. If it is, what is the common difference?
2, 7, 13, 20...
D: no
11. Tell whether the sequence is arithmetic. If it is, what is the common difference?
20, 11, 2, -7
B: yes, -9
12. Bamboo plants grow rapidly. A bamboo plant is 130 inches tall. Tomorrow it will be 143 inches tall, the next day it will be 156 inches tall, and on the next day it will be 169 inches tall. Write a rule to represent the height of the bamboo plant as an arithmetic sequence. How tall will the plant be in 12 days?
A: A(n)=130+(n-1)13; 273 inches
13. A magician charges $50.00 for a visit and an additional $7.50 for each hour he performs. The function rule C = 7.50h + 50.00 describes the relationship between the number of hours h and the total cost of the visit C. If the magician will only visit a maximum of 8 hours, what is a reasonable graph of the function rule?
C: {first point is (0,50), second point is (4,80), and third point is (8,110)}
14. What is the graph of the function rule?
y= |5x|-2
C: {looks like a downward point. point is at (0,-2)}
15. A triangle pattern is shown bellow. The perimeter of each figure in the pattern is shown in the table.
Figure | Perimeter
1 tri 24
2 tri 30
3 tri 36
A: P=6n+18
QUESTIOSN 16-19 HAVE YET TO BE GRADED
16. Use the vertical line test to determine if the relation {(-6,-2), (-2,6), (0,3), (3,5)} is a function. Explain your response.
Answer: The relation is a function because each domain value is paired with one range value. If your graph each ordered pair to check with the vertical line test, then the line will pass through each point once.
17. The graph shows the number of handbags that Mandy made in one day. What are the variables? Describe how they are related.
Answer: As the amount of time increases, the amount of handbags Mandy has made also increases. Time is the independent variable and the number of handbags is the dependent variable.
18. During a clothing store's Bargain Days, the regular price for T-shirts is discounted to $8.25. You have an additional coupon for $5.00 off, regardless of how many shirts are purchased
a. Write a rule for the function p(t) that expresses the finale price of t T-shirts with the discount applied.
b. How much would you pay during Bargain Day for 11 shirts?
Answer:
a. p(t)=$8.25t+$5.00
t=11
b. $8.25(11)-$5.00=$85.75
19.The table shows how much a carpenter charges for work. Is the relationship shown by the data in the table linear? Explain your answer.
Hours Worked | Amount Charged ($)
1 25
2 40
3 60
4 80
Answer: The table is not linear. The first hour worked is $25. The second hour worked is $40. It goes up $15 and then $20. It is not constant and wouldn't graph a straight line.
thanks
Guys Stop Cheating on your test! we will catch you and you will be punished!
I hope you know the whole different answer thing is a lie we all get the same test
Some of them are wrong.
1. B
2. D
3. B
4. C
5. A
6. B
7. B
8. B
9. C
10. D
11. B
12. A
13. C
14. D
15. D
16. No, the points are random.
17. The time increases so the number of bags increase too. The time is independent and the bag is dependent
18. A. P(r) = (P - 5) + 0.05(P-5) = 1.05(P-5). P = regular price. B. Pr = 1.05(P-5) = 1.05(15.50-5) = $11.03
19. Yes, the points make a straight line.
Hey y'all I just toke the test and got 100%.
THIS IS FOR THE UNIT 5: LESSON 9 INTRODUCTION TO FUNCTIONS TEST!
1. C
2. D
3. D
4. C
5. A
6. B
7. A
8. D
9. A
10. D
11. D
12. B
13. A
14. D
15. B
16-19 Are extended response. Do it yourself it really isn't hard. But don't listen to YEE because they are wrong for that part and the rest of the test!
Hope you guys are happy! And I swear these are right I literally just did it on my own and got 100%.