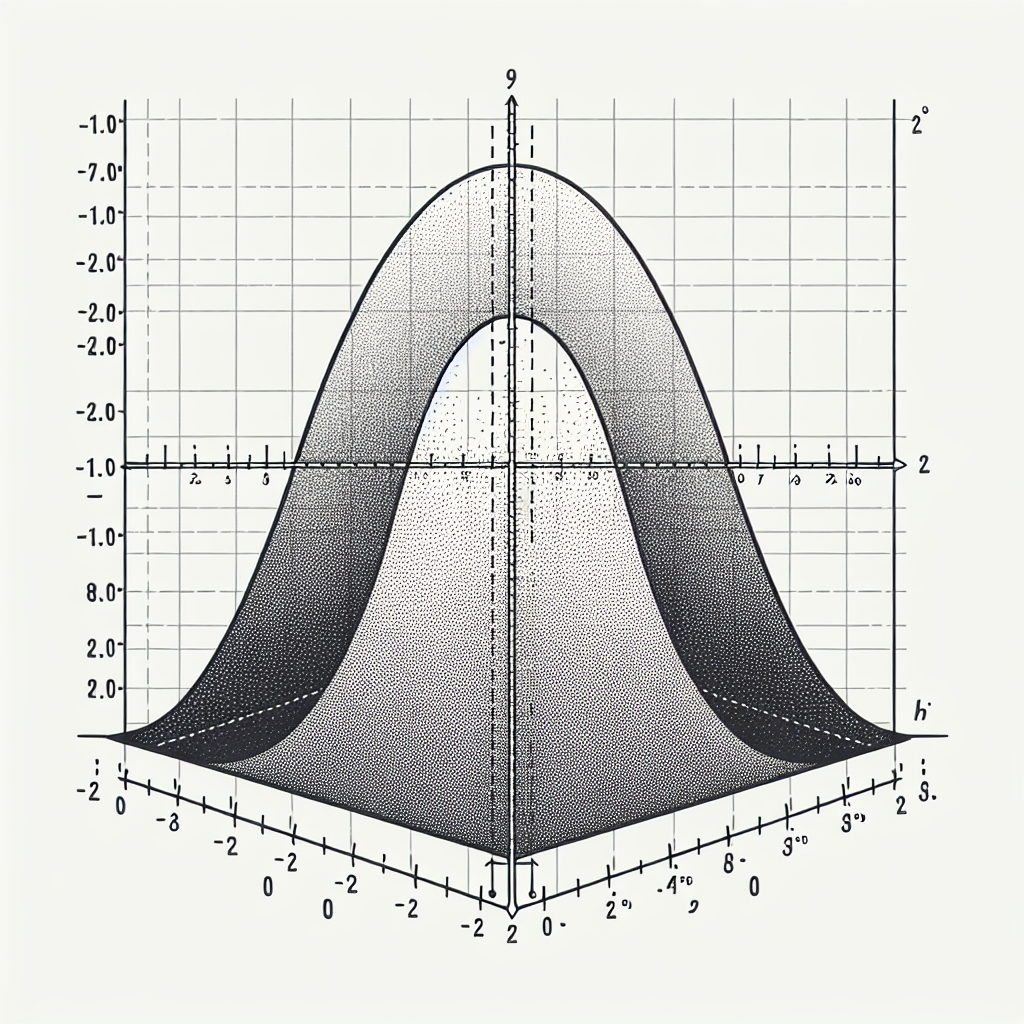
What percentage of the area of the standard normal distribution is between z = -1.00 and z = +1.00? How do you know this?
=P(-1.00<1.00)
=0.3413+0.3413
=0.6826 or 68.26%
Therefore, 68.26% is the percentage.
Find table in the back of your statistics text labeled something like "areas under normal distribution" to find the proportions related to the Z scores.
68%
z = 1.00 *
What do you call a fraction that's always positive? An optimist!
Now, to answer your question, approximately 68% of the area under the standard normal distribution curve falls between z = -1.00 and z = +1.00. This is known because of the 68-95-99.7 rule or the empirical rule. The rule states that in a normal distribution, approximately 68% of the data falls within one standard deviation of the mean. So, since the standard normal distribution has a mean of 0 and a standard deviation of 1, we can conclude that roughly 68% of the area falls between -1.00 and +1.00.
To find the percentage of the area of the standard normal distribution between z = -1.00 and z = +1.00, we can use the properties of the standard normal distribution.
The standard normal distribution has a mean (μ) of 0 and a standard deviation (σ) of 1. It is a symmetrical distribution, where the area under the curve is equal to 1.
In this case, we want to find the area between z = -1.00 and z = +1.00. Since the distribution is symmetrical, this area is the same as finding the area to the left of z = +1.00 and subtracting the area to the left of z = -1.00.
To calculate the area to the left of a given z-score, we use a table called the standard normal distribution table (also known as the z-table). The z-table provides the percentage of the area under the curve to the left of a given z-score.
For z = +1.00, we look up the value in the z-table and find that the area to the left of z = +1.00 is 0.8413.
For z = -1.00, we look up the value in the z-table and find that the area to the left of z = -1.00 is 0.1587.
To find the area between z = -1.00 and z = +1.00, we subtract the area to the left of z = -1.00 from the area to the left of z = +1.00:
0.8413 - 0.1587 = 0.6826
So, approximately 68.26% of the area of the standard normal distribution is between z = -1.00 and z = +1.00.