A number of candidates interviewed recently revealed that 142 applied for admission into university of lagos ,122 for illorin and 118 for jos
66 had applied for lagos,48 for ilorin and jos,58 for lagos and jos while 32 had applied for all three universities. a)Illustrate the information using Venn diagram
You will need to construct three circles that overlap each other in a standard venn diagram. THen you will need to start from the center most intersection where the 32 had applied for all three universities... and work your way out : )
A quick google search for three venn diagrams will aid you as well : )
I can check the numbers you generate for each intersection if you wish.
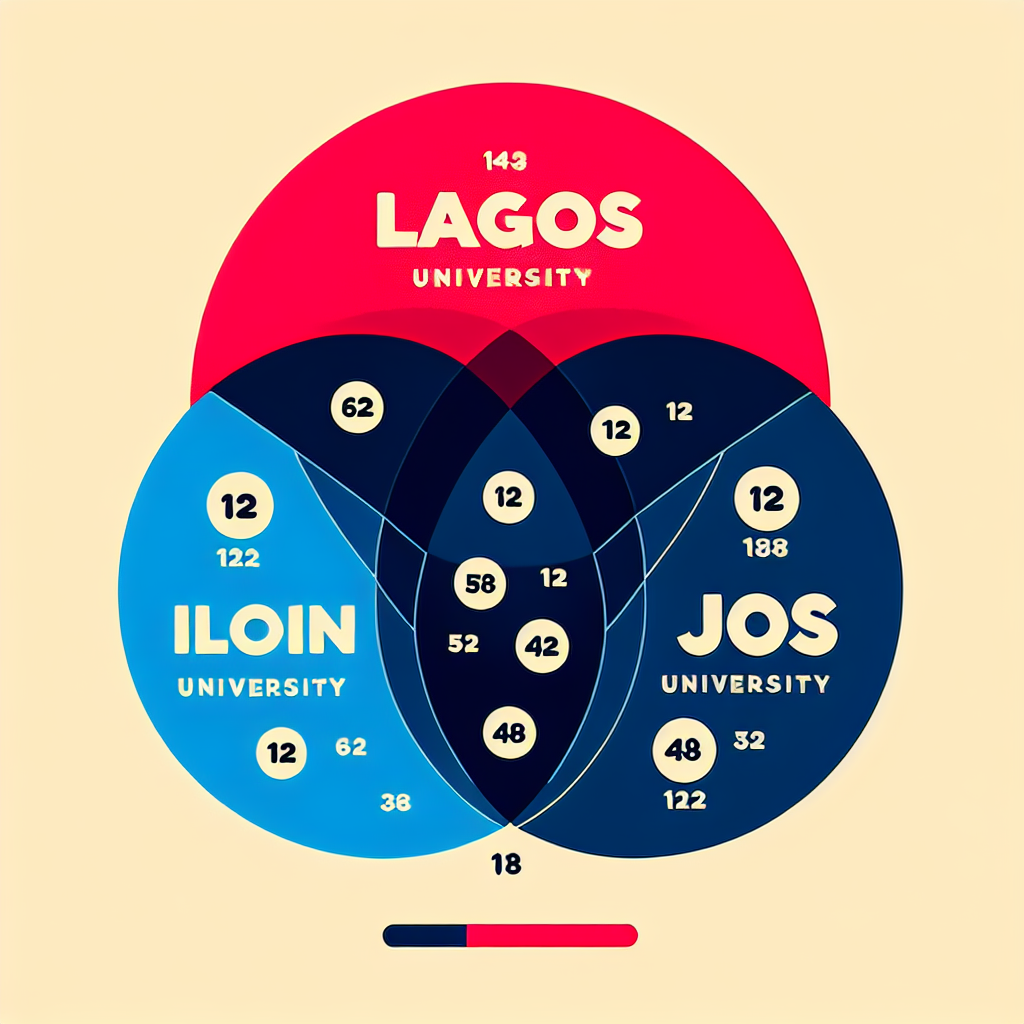
The venn diagram is a three circle diagram
Yes
Answer
You will need to................ ,. ..........m........ .
U= 338
Venn diagram
Lagos intersect iiorin only =34
Lagos intersect Jos only =26
Iiorin intersect Jos only= 16
Lagos only 82
Iiorin only= 72
Jos only= 76
Based on the provided information, the Venn diagram would look like this:
_________
/ Lagos \
/ (66-32) \
\ _________ /
\ /
\ (16) Jos /
\____________/
___________
\ Iiorin \
\ (48-32) \
\ ___________ /
\ /
\ (34) Lagos /
\____________/
____________
\ Jos \
\ (58-32) \
\ ____________/
\ /
\ (72) Iiorin /
\_____________/
In the diagram, the numbers in parentheses represent the number of candidates who applied only to that specific university.
To verify the numbers, we can add up the individual categories:
- Lagos only: 66 - 32 = 34
- Iiorin only: 48 - 32 = 16
- Jos only: 58 - 32 = 26
- Lagos intersect Iiorin only: 34
- Lagos intersect Jos only: 66 - 32 - 34 = 0
- Iiorin intersect Jos only: 48 - 32 - 16 = 0
- Applied to all three universities: 32
These numbers match the given information correctly.
To illustrate the given information using a Venn diagram:
1. Start by drawing three overlapping circles, each representing one university: University of Lagos (L), University of Ilorin (I), and University of Jos (J).
2. Label the overlapping region between L and I as "48" since 48 candidates applied for both Lagos and Ilorin.
3. Label the overlapping region between I and J as "48" since 48 candidates applied for both Ilorin and Jos.
4. Label the overlapping region between L and J as "58" since 58 candidates applied for both Lagos and Jos.
5. Finally, label the intersection of all three circles as "32" since 32 candidates applied for admission to all three universities.
The Venn diagram should now visually represent the given information.