1.
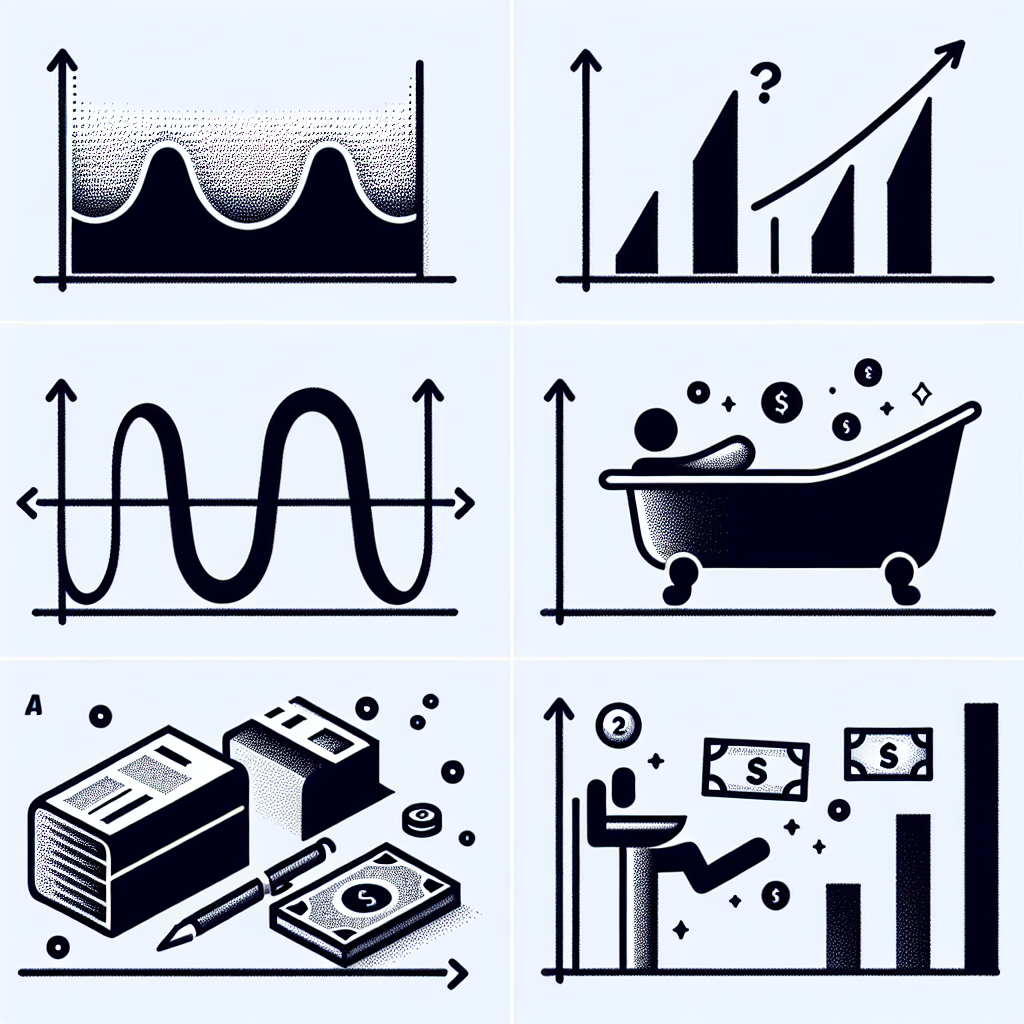
Which graph might show the temperature during a 24-hour period? (1 point)
A
B
C
D
2.
Which graph might show the amount of money in a bank account if money is never taken out? (1 point)
A
B
C
D
3.
Which graph might show the amount of money in a bank account if money is saved for several months and then taken out for a vacation? (1 point)
A
B
C
D
4.
Which graph might show the depth of water in a bathtub after the drain is pulled? (1 point)
A
B
C
D
Here are the answer actually:
1st: B
2nd: C
3rd: D
4th: A
Hope that helps!
They are the correct answer because i have taken the test and got 100!
Yes they are correct.
Thank you so much! I need my answers checked <3
They are right! I got 4/4 100%
the ansers are
B
C
D
A
i promise this is for connexus for 2018
Lesson 2: Relating Graphs and Events
Algebra Readiness (Pre-Algebra) B Unit 1: Functions
Quick Check Answers:
1. B
2. C
3. D
4. A
These answers are still correct in 2019, specifically 1/24/2019
Remember the teachers can change the answers though, but as for now these answers will get you a 4/4 100%
Have a nice day or night people of Connexus/Connections Academy